WILDFIRES: THE WORST IS YET TO COME
September 21, 2020 § 2 Comments
California is ablaze. So are Oregon and Washington. The tally to date is 5 million acres burned, about halfway through the fire season, and well on its way to record territory. Putting that in perspective, the east coast of Australia, devastated similarly earlier this year in the Southern Hemisphere summer, closed the season with 46 million acres burned.
The statistic of greatest concern is that the intensity and scale of the fires is getting worse. Over the last thirty years, the number of fires annually has no discernible trend; certainly, has not gone up. But the acreage burned has; decisively. Both patterns are evident in the figure below. Five of the ten largest fires ever in California are currently active. The largest of these, the August Complex is already at 839,000 acres and still going. The next largest, ever, was 459,000 acres, the Mendocino Complex in 2018. Labeling any of this chance, or poor forestry management, evokes imagery of the proverbial ostrich, and the placement of its head.
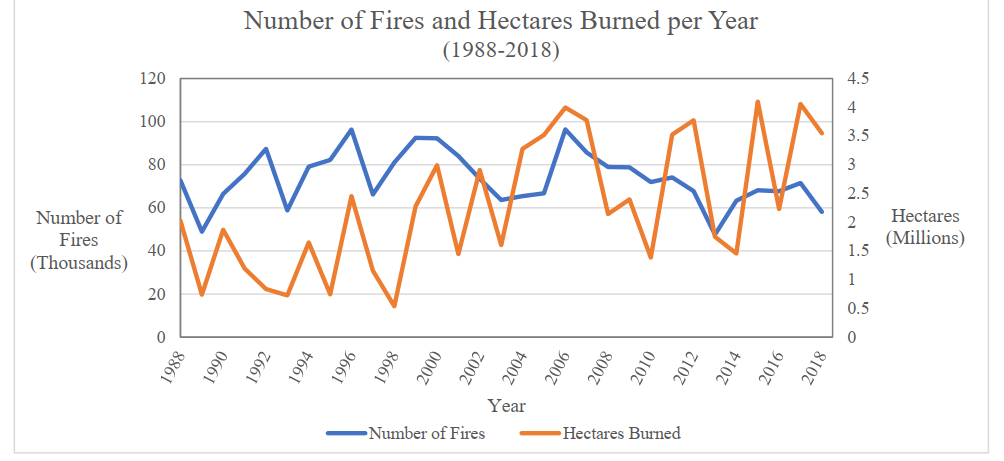
The average hectares (a hectare is roughly 2.47 acres) burned has nearly doubled over this three-decade period. Nine of the ten largest fires have occurred since the year 2000. Note that this does not include the ongoing five, which certainly would be in that group, making it 14 of the 15 since 2000. Although a regression line would have uncertainty due to big annual swings, an eyeball estimate indicates a strong upward slope. If this is a predictor of the future, that future is indeed bleak and warrants a study of causes.
The recent EPA report, from which the figure was reproduced, ascribes the pattern of increased fire acreage to higher temperatures, drought, early snow melts and historically high fuel loading (which is the fire prone vegetation, including underbrush). We will examine these separately, although they may not be disconnected. But first, a comment on the pattern of numbers of fires being essentially flat. Ignition events determine numbers of fires. In California, the principal ones are arson, campfires, power lines and equipment. The equipment category comprises items such as power saws, mowers, and other operated machinery. Human behavior, absent intervention, can be expected to be constant. So, the flat profile on numbers of fires is to be expected. Interestingly, the incidences are seasonal, even, counter-intuitively, arson.
Climate change is implicated in many of the causes of increasing severity over the years. While the term has many interpretations, one generally accepted aspect is temperature rise in the atmosphere and in the oceans. The debate is not whether this happens, but how fast it does. Also generally accepted (to the extent any climate change causality is generally accepted) is that oceanic temperature rise causes increased severity in the El Niño phenomenon in the Pacific Ocean, which is responsible for catastrophic droughts. These are accompanied by drenching rains in other parts of the world in the same year. Both disturbances are extreme deviations from the norm, with resultant impact on vegetation and the way of life.
Atmospheric temperature rise can also be expected to change the proportion of rain and snow in precipitation. Lighter snowfall can be a result, as also early snow melts. Both are in the EPA list noted above.
California, being generally arid, gets most of its water supply from melting snow. While less snow in a given year is certainly a drought indicator, the phenomenon most studied is that of the timing of the snow melt. Data from four decades commencing in 1973 conclusively demonstrated that burn acreage was strongly correlated with the earliness of the snow melt (Westerling 2016). Decadal comparisons show that the fire seasons in 2003-2012 averaged 40 more days that the seasons in 1973-1982. Fires in the later decade were more severe. Large fires, defined as covering greater than 400 hectares, burned for 6 days on average in the early decade and for more than 50 days in 2003-2012.
Power lines deserve special mention. Falling power lines were blamed for several fires in 2017 and 2018. The utility has accepted blame and is in bankruptcy. Trees falling on power lines snapped the poles. The tree roots, finding uncertain purchase due to drought conditions, were no match for the Santa Ana winds or any other storm sourced shoves. Those same drought conditions caused the underbrush to be dry. Power lines are usually not insulated. Sparking wires on dry underbrush and the rest is incendiary history. A poster child for distributed power.
The wildfire future is indeed bleak. Climate change retardation is necessary. But it may not be sufficient in the shorter term. We need a reincarnation of Smoky to change human behavior to minimize the ignition events.
Westerling, A. L. (2016) ‘Increasing western US forest wildfire activity: sensitivity to changes in the timing of spring’, Philosophical Transactions of the Royal Society B: Biological Sciences, 371: 20150178. http://dx.doi.org/10.1098/rstb.2015.0178
Vikram Rao September 21, 2020

Vik
I am surprised that you did not touch upon the Siberian fire which is bigger than the west coast one and involves permafrost!! Raging for the last few weeks?
Bhima
Bhima Sastri, Ph.D.
Director, Crosscutting R&D and Systems Integration
Room E-132, 19901 Germantown Road,
Germantown, MD 20874
Email: bhima.sastri@hq.doe.gov
301-903-8821 (work)
240-682-7060 (Cell)
Vik,
You might look at https://www.latimes.com/environment/story/2020-09-13/150-million-dead-trees-wildfires-sierra-nevada, This points out the additional role of overzealous fire prevention and underfunded controlled burning. Among other points, the article cites climate change and too little burning as a contributor to the massive bark beetle attacks which have killed 150m trees in the Sierras, converting them to fuel.