How Well Can Electricity Replace Fossil Fuel?
March 24, 2024 § Leave a comment
The UNC Cleantech Summit last week had a panel on this topic, on which I served. Here is one take on this rapidly accelerating trend in the decarbonization of industrial processes. But first some fundamentals.
Processes use fossil fuel in four different ways. The most common use is to produce heat to enable a process. An example in the hard to abate cement/concrete industry is the calcination of limestone in a rotary kiln together with other oxides such as silica to produce clinker. The clinker is blended with crushed rock, known as aggregate, and acts a binder for the aggregate particles. The clinker blend usually comprises about 15% of the concrete. The clinker is often combined with other cementitious materials such as fly ash from coal fired power plants and blast furnace slag, the primary purpose being to reduce the amount of clinker used. This purpose in turn is driven in part by the desire to reduce the carbon footprint, and in part because these other materials ought to be cheaper and but for utilization in means such as this, would be treated as wastes. States such as North Carolina have had to deal with environmental crises such as storm induced overflow of fly ash “lagoons”.
The rotary kiln calcination process causes about 0.9 tonne CO2 per tonne clinker produced. About half of this is from the fossil fuel combusted to produce the 1500 C temperatures required. The rest is from the chemical reduction of CaCO3 to CaO and CO2. One remedy is to produce the heat with electric heating. But this addresses only half the problem. Another electricity-based approach, one that was presented at the cited conference, is by Sublime Systems. They electrochemically decompose silicate minerals to produce Ca(OH)2, which may be used in place of Portland Cement.
Fossil fuel is also used as reactant in the process. An example is the use of coke in an iron blast furnace. The carbon is oxidized to CO, which then reacts with the iron oxide in the ore to produce metallic iron and CO2. The molten iron, containing about 4% C, is sent to a Basic Oxygen Furnace, where it is lanced with oxygen. The combustion of the contained C produces heat and serves to reduce the C to the desired amount in steel, which is usually less than 0.3 % for mild steel. This too produces CO2. Overall, steel has a CO2 footprint of about 2 tonne CO2 per tonne steel. One approach to electrification of the process is that of Boston Metals, where they electrochemically dissociate iron oxide to molten iron.
Fossil fuel may also be used as raw material for a process. Hydrogen is produced today dominantly by the process of steam methane reforming. Methane is the raw material and is reacted with steam to produce hydrogen and CO2. Roughly 9 Kg CO2 is emitted per Kg of hydrogen produced. This is classified as gray hydrogen. If the CO2 is captured and stored, the color turns blue. Hydrogen produced by electrolysis of water is termed green if the electricity is carbon-free. Yet another electrolytic process in late-stage development uses microwave pyrolysis of methane to produce hydrogen and carbon.
Finally, we have the use of fossil fuel to drive an engine. This covers the gamut from internal combustion engines for road vehicles to aviation. Electric vehicles are the best example of fossil fuel replacement. A variant is the use of hydrogen in fuel cells to produce electricity on board electric vehicles. A further possible use is in aviation as engine fuel, although biofuel derived jet fuel is the more likely workhorse. Electric drive planes will be limited in size and scope.
Availability of Green Electricity
The electricity substitutions discussed above are carbon mitigating only if the electricity is carbon-free or substantially so. Carbon-free grids are still at least a decade away, more likely two. This is largely due to the fact that solar and wind are the new sheriffs in energy town. They are the low-cost source of energy in many jurisdictions, clean or otherwise. But they have monthly average capacity factors well below 25% and 40%, respectively. Grids want them for the low cost and renewable feature but must fill the gaps with other sources. The principal longer duration gap filler today, and for the next decade at least, is natural gas. Also, the last 40% is expensive to get carbon-free. Remedies are available, in the form of geothermal, small modular reactors and innovative storage means, but they will be a while getting to scale.
To make matters worse, according to a recent story in the NY Times, all electricity demand is expected to increase steeply over the next decade after being essentially flat over the last one. This is presumably due to the explosion in data centers, most recently compounded by generative AI, which is extremely compute intensive (read power hog). Adding to the demand is the up and down phenomenon of bit coin, also compute intensive. And, of course, electric mobility.
This is not to say that electricity substitution of fossil fuels is impractical*. It is to say that individual operations will find it difficult to get 24/7/365 clean electricity, and it is also to say that carbon-free grids need policy support to accelerate the gap fillers. At least this ought to come in the form of drastic reductions in the times of permitting.
Technology is necessary, but not sufficient.
*Do you believe in magic? From Do You Believe in Magic, by the Lovin’ Spoonful, written by John Sebastian.
Vikram Rao
DIRECT AIR CAPTURE IS A SUBSIDY PLAY
November 12, 2023 § 2 Comments
A recent story in the New York Times describes what the author refers to as the first commercial plant in the US that captures CO2 from the air. This is the class of operations known as Direct Air Capture (DAC). Costs are not disclosed except for noting that similar technologies elsewhere cost up to USD 600 per tonne CO2 removed, and that this company intends to bring costs down to USD 100 per tonne. Corporations are buying carbon credits from the DAC operator and offsetting against their own generation. The federal 45Q legislation will also pay a subsidy which is as much as USD 85 per tonne, the amount depending on the permanence of the sequestration.
Clearly, therefore, declaring victory in the US in this atmospheric carbon mitigation sector involves some sort of subsidy, from a private or public source. In Europe, cap and trade legislation sets a penalty for emission, the avoidance of which would pay for the capture. That price has ranged from € 80 to 100 per tonne in 2023. In both cases, some sort of government legislation is defraying the cost of capture, and the business is not inherently profitable.
In contrast, many of the other carbon mitigation means are profitable in their own right. This certainly includes renewable electricity production by solar and wind, which are the lowest cost providers, at a profit, in many jurisdictions. Electric vehicles, with zero tailpipe emissions, are also profitable. These two examples fall in the category of process change to minimize CO2 emissions. Changing the process is the most effective, and usually involves using a fuel other than hydrocarbons (yes, we consider sunlight and wind as “fuels” in context). But displacing incumbents is hard, in part because the capital being replaced may be far from being amortized. This is the future facing those other two major emitters after transportation, steel, and cement.
The two principal approaches to preventing emissions are changing the process or capturing in the output. The latter is alluded to as point source capture, and while still in commercialization infancy, CO2 could be captured at source for under USD 40 per tonne. That figure could be expected to go down further, to about USD 30. Once captured, it must be stored or put to beneficial use. The highest value beneficial use in practice today is tertiary recovery of oil. Oil left behind after conventional recovery is swept with CO2, which mixes with the oil, thus reducing viscosity and increasing mobility. Much of the gas is recovered on the surface and reused. Many efforts are also under way to mix the CO2 with concrete. The most promising may be the mineralization of igneous rocks to form a stable carbonate, for use or disposal.
Carbon Capture
Capture is accomplished in one of two ways. In the most common process, a liquid such as an amine absorbs the CO2 and the amine is regenerated by releasing the CO2 in concentrated form, which is then disposed of. The other class of processes uses a solid to adsorb the CO2, which is later released by pressure or temperature change, and the solid reused. Once again, the CO2 is in concentrated form. Most DAC processes, including the one cited in the linked story, are some variants of the solid adsorbent method.
In either of the methods, the process is more efficient if the CO2 concentration is higher. Accordingly, capture costs are roughly inversely proportional to the concentration. The cost per tonne captured will be lower for cement kilns, with CO2 concentrations north of 25%, than for iron blast furnaces, with concentrations in the mid-teens. Costlier yet is capture from natural gas power plants, with concentrations in mid-single digits. And then we have DAC. The concentration of CO2 in air is 0.04% (and rising!). There you have it, no wonder then that USD 100 per tonne is seen as a win.
Why DAC?
Why go after the costliest capture, and why not just double down on point source capture, low C electricity production and electric transportation? Many argue that capturing from the air gives a free pass for business as usual. But that argument could also be made for point source capture, albeit not as strongly.
The answer lies in how far behind we are in carbon mitigation. Point source capture will certainly involve retiring of assets, some of which may not be fully amortized. Acceleration of retirements may require policy support (read subsidies). Electric vehicles are being subsidized now. The key point is that even with an all of the above approach with emission prevention, we may fall short of reasonable 2050 atmospheric CO2 targets unless we do something about the CO2 already in the air.
So, yes, we need DAC. But it is indeed a subsidy play, and subsidies come and go, subject to the whims of the folks in power (look no further than the history of subsidies related to wind power) *.
*Drove my Chevy to the levy, but the levy was dry, from American Pie, written and performed by Don McLean (1971)
Vikram Rao
November 12, 2023
Climate Change Increases Wildfire Severity
August 8, 2023 § Leave a comment
We now have the smoking gun
Eight of the ten largest wildfires ever in California occurred after 2017. The August Fire in 2020 burnt over a million acres. At the time, the next largest had been the Mendocino Complex in 2018, which burned 459000 acres. Then, the Dixie Fire in 2021was nearly as large as the record holder. Most, not all, scientists attribute this to climate change. But causality has been hard to establish. Then came the recent paper in The Proceedings of the National Academy of Sciences (PNAS) which was as close to a smoking gun as one could have when dealing with multiple variables. More on that later, but first some basics.
The severity of a fire season is often judged by the acreage burned, not the number of fires. This makes sense because that is the metric which is connected to the impact on society. The difference stands out when fire activity is examined over the last few decades. Shown in Figure 1 are US Environmental Protection Agency (EPA) wildfire figures for both metrics over three decades.

Courtesy US EPA 2019 (Wildland Fire Research Framework 2019-2022)
Figure 1. Time series of numbers of fires and area burned in the period 1988 – 2018.
The numbers of fires have no perceptible trend, although one can see a general progression downwards in the last decade. The acreage burned, on the other hand, has seen a gradual slope up, even though a regression line would show significant uncertainty due to the severe annual swings. Interestingly, the 2020 figure (not shown) is not that different from the 2017, even though five of the 10 largest fires ever were in 2020. A fire is considered large when the area burned is greater than 400 hectares (a hectare is roughly 2.47 acres). Acreage burned is dominated by the larger fires. Obviously, the impact on society is proportional to the area burned and the durations of the fires. One study showed that durations of large fire (>400 hectare) burns averaged 6 days in the period 1973-82 and was over 50 in 2003-12.
In attempting to unravel the distinction between the patterns in numbers and extents of fires, one statistic stands out. In recent years, ninety five percent of fires in California and the Mediterranean region have been caused by human activity (Syphard and Keeley, 2015). These activities include campfires, arson, equipment (such as chainsaws and mowers), vehicles, falling power lines, and controlled burns gone, well, uncontrolled. While human behavior can be influenced (the Smokey Bear program, for example), not surprising is the fact that the trend in the number of ignitions has been generally flat. Among natural ignition events lightning plays an interesting part. Depending on region, it ordinarily clocks in as the 4th to 8th most frequent contributor to ignition. The 2020 fire season changed all that. Cal Fire, a state agency reports that 4 of the 7 largest fires ever were triggered by lightning.
Effect of Climate Change
The progressively increasing severity of wildfires cannot really be in doubt. The data, such as in the figure above, speak for themselves. And, yes, the globe is warming incrementally. Also not seriously questioned is the observation that instances of severe weather have increased, ranging from droughts to floods, as have phenomena such as El Nino and La Nina, which are correlated with severity of weather. The western United States is a reasonable proxy for the relationship between climate change and wildfire severity. The states are arid and depend upon winter precipitation, primarily snowfall, for year-round water for consumption. An increasingly warming climate predicted reduced snowfalls, and earlier snowmelts. This latter statistic was shown to be strongly correlated with areas burned by wildfires. Other observations, such as climate change mediated drought conditions leading to more flammable matter (fuel), have added to the body of belief that climate change was increasing severity of wildfires. Yet, anything approaching causality had been elusive.
Then came the PNAS paper mentioned above.

Courtesy PNAS, Excerpted from Turco M. et al. (2023)
Figure 2. Time series of summer wildfire burn area (BA) and spring through summer monthly average maximum near-surface air temperature (TSmax) for the period 1971- 2021.
The authors used data from California to model area burned in wildfires (BA) against various parameters. Plotted in Figure 2 is burned area (on a log scale) against TSmax, which is the monthly mean of daily maximum near-surface air temperatures. The temperatures were in the period April – October, while the BA was in a smaller summer months subset of May – September. The temperature data are the open circles and black lines, while the BA are the filled circles and red lines.
The most striking finding is that the single parameter of surface temperature correlated extremely well with area burned*. If there is one parameter that is indelibly linked to climate change, it is global warming, characterized by rise in ambient temperatures. The results of the model are a correlation of 0.84 between the two parameters, with a P-value (a parameter indicating statistical significance) <0.01. Statisticians will find that to be strong. Most of the rest of us can see that it passes the eyeball test. Without exception, the years in which the black circles rise or drop, so do the red ones. Not all equally strikingly, but follow they do. The data from the first and last three years of the study are extraordinary in this regard. The authors also found that normalizing for precipitation did not make much difference.
In the end, there is only one measure that will actively address severity of wildfires: slowing down the inexorable march of ever higher near-surface temperatures. Much is happening in that space. More is needed.
Vikram Rao
August 7, 2023
* Everybody look, what’s going down, in For What it’s Worth, by Buffalo Springfield, 1966, written by Steven Stills
References
Turco M. et al. (2023) Anthropogenic climate change impacts exacerbate summer forest fires in California. Proceedings of the National Academy of Sciences 120, e2213815120 https://doi.org/10.1073/pnas.2213815120
Syphard AD, Keeley JE (2015) Location, timing and extent of wildfire vary by cause of ignition. International Journal of Wildland Fire 24, 37–47. doi:10.1071/WF14024
How Green Can Steel Get?
March 25, 2023 § 1 Comment
Steel is considered a “hard to abate” commodity because the production process uses a lot of fossil fuel and alternative processing methods are not readily available. The first step in the production is reducing iron ore (an oxide) to metallic iron. This is a continuous process performed in a vertical shaft furnace known as a blast furnace and the reducing agent is a form of processed coal known as coke. This is the primary culprit responsible for the high carbon footprint of steel, which is estimated to be about 2.2 tonne CO2e per tonne steel. By comparison, that other hard to abate structural commodity, cement, has a footprint of about 1 tonne CO2e per tonne cement.
The molten iron containing a few percent carbon is transferred from the blast furnace directly to a Basic Oxygen Furnace, where much of the carbon is oxidized to produce steel, which requires the carbon to be a fraction of a percent. This is known as primary steel. Steel produced from remelting scrap iron and steel is known as secondary steel, and has a very small carbon footprint, but is in relatively short supply.
A recent report from the Rocky Mountain Institute (RMI) provides a review of alternate ironmaking with lower carbon footprint. Their figure is reproduced below.

Courtesy RMI
They highlight the Direct Reduction Iron (DRI) process as the primary means to greener steel. This process has a vertical shaft variant which uses synthesis gas (syngas), a mixture of CO and H2, as the reducing agent, instead of coke. The operating temperatures are also less than half that in blast furnaces. The result is a reduction of associated carbon to 0.8 tonne CO2e per tonne steel, after the iron is converted to steel in an electric arc furnace (labeled EAF in the figure).
The report advocates a recent variant comprising substituting H2 for the syngas, piloted by a Swedish entity Hybrit. This is straightforward because syngas can be reacted with water in what is known as the Water Gas Shift reaction to produce H2 and CO2, which, if sequestered, makes the hydrogen carbon free (although saddled with the color blue, rather than green). Alternatively, green hydrogen could be produced from electrolyzing water with carbon-free electricity. The report advocates this approach, and further estimates that if green electricity is used in the EAF as well, the carbon emissions associated with a tonne of steel drop to 0.1 tonne (see figure).
So, there you appear to have it. Switch to the DRI/EAF process and use green electricity for the EAF and to produce hydrogen as the reducing agent. The RMI report notes that the steel industry has vertically integrated to ensure supply of relatively scarce coking coal. It advocates that the new process do the same with respect to green electricity supply. This may well be necessary because grids will not be carbon-free for a long time (see https://www.rti.org/rti-press-publication/carbon-free-power). Captive supply will also have a lot of competition. But it could be done, certainly over time.
But there is a fly in that ointment. This is the fact that the DRI process can only use high grade iron ore, with over 64% iron, preferably over 67%. Those who don’t care why should skip the rest of this paragraph. In a blast furnace the mineral impurities such as silica and alumina are removed by combining with oxides of Ca and Mg to form a molten phase known as slag. This floats on top of the molten iron and both are removed continuously. In the DRI process the temperatures are too low for slag formation. Consequently, very small proportions of mineral impurities are tolerated. These small amounts are slagged in the EAF. Low impurities equate to high grade iron ore. Hence the requirement for the ore to be high grade.
Such high-grade ore is in very short supply. Most of the known reserves are in Brazil and Australia. The DRI process has been commercial for decades, but only about 7% of the steel supply comes from this source. The shortage of supply (and of world reserves, for that matter) and the higher cost of the high-grade ore are contributory factors.
Before we get into my opinion on the way forward, two other avenues to green(er) steel bear mention. A story in The Economist describes a way to clean up the blast furnace process. The CO2 emitted is broken down into CO and oxygen using perovskites (essentially known science). The CO is used as the reducing agent in the furnace (instead of coke) and the oxygen is used in the steelmaking. There are practical issues in replacing the structural aspects of the coke. But the allure is that it modifies existing capital equipment. A complete departure from the blast furnace is electrolytic steel. The clever bit in a recent embodiment is their inert anodes. But the electricity must be carbon-free for the steel to qualify as green. And the process uses a lot of it: 4 MWh per tonne of steel. Scaling to anywhere close to the world usage of 2 billion tonnes per year means the need for a high fraction of all the power produced, leave alone the clean power. And as we noted earlier, carbon-free grids are not in the immediate future.
Where does that leave us? My favorite is the DRI/EAF with hydrogen, especially if we are not too choosy on the color of hydrogen; blue will do till green is feasible at scale. It is a tweak to an accepted process, essentially the same work force, so more easily acceptable. And that can be important for a staid industry such as iron and steel. The high-grade ore is the main hurdle to scale. Magnetite is the highest-grade variety, and it could be actively prospected. There will not be enough. We need another source.
One such is ultramafic rocks such as olivine, which are some of the most abundant minerals on earth and close to the surface. These are mixed silicates of iron and magnesium (in the main). Early-stage research offers the promise of extracting the Fe portion, and as luck (and thermodynamics) would have it, the Fe will be in a valence state making the oxide magnetite.
The CO2 in blast furnace emissions can be captured and stored for under USD 50 per tonne of CO2 with technology available today. This is well below the carbon penalty in Europe today. Partial use of hydrogen as a coke substitute would be minimally intrusive.
The two approaches above could handle the bulk of the decarbonization. They could be supplemented by electrolytic steel where captive carbon-free electricity could be arranged.
And don’t forget that Kermit the Frog said*, “It’s not easy being green”.
Vikram Rao
March 25, 2023
*Bein’ Green, Song by Kermit the Frog (Jim Henson), 1970, written by Joe Raposo
Peat Bogs: Nature’s Best Carbon Capture Systems
March 13, 2023 § 3 Comments
Direct air capture of CO2 (DAC) is all the vogue in carbon capture, with considerable innovation occurring. Nature tried its hand at innovating in the passive DAC space a while back. The public is very familiar with the role of forests. To a lesser degree, also known is the role of oceans as carbon sinks.
But it may surprise many that there is a form of vegetation that does a far better job than trees. Five times better per square meter in places. These are plants in peat bogs, which capture CO2 and transfer it over time to the organic layer below, which results in the material we know as peat. Peat may be classified as a very early form of coal, with as little as 40% carbon. Were it to be subjected to higher temperatures and pressures by being buried under sediment, it would eventually convert to lignite, and thence to bituminous and finally anthracite coal. The last clocks in at over 90% carbon and looks like a shiny black rock. Countries, such as Estonia, which are short of other hydrocarbons, have combusted peat for electricity. In other places, regular folks have retrieved buckets of peat from the bogs and burned them for fuel.

Source: Peat Bogs Wallpapers High Quality | Download Free (yesofcorsa.com)
But it may surprise many that there is a form of vegetation that does a far better job than trees. Five times better per square meter in places. These are plants in peat bogs, which capture CO2 and transfer it over time to the organic layer below, which results in the material we know as peat. Peat may be classified as a very early form of coal, with as little as 40% carbon. Were it to be subjected to higher temperatures and pressures by being buried under sediment, it would eventually convert to lignite, and thence to bituminous and finally anthracite coal. The last clocks in at over 90% carbon and looks like a shiny black rock. Countries, such as Estonia, which are short of other hydrocarbons, have combusted peat for electricity. In other places, regular folks have retrieved buckets of peat from the bogs and burned them for fuel.
Peat bogs comprise only 3% of the surface of the earth, but account for 30% of the land-based stored carbon, which is double that stored by all forests combined. For comparison, forests cover about 31% of the earth’s surface. A recent paper compares carbon storage by trees and peat in boreal forested peatland (peatland that also has partial or complete tree canopy). They estimate that the organic storage is higher in the peat layers than in the trees and subsoil (11.0–12.6 kg m−2 versus 2.8–5.7 kg m−2) over a “short” period of 200 years.
And yet, saving rainforests gets all the ink. Save the peat bog does not have the same ring. And yet, it should. Admittedly, on imagery alone, a bog finds it hard to compete against a rainforest. Cuddly koala bears versus fanged Tasmanian Devils (mind you, as any Aussie knows, real-life koalas are not to be messed with either, and in a further nod to excellent promotion, they are not even bears, they are marsupials, as are kangaroos). And the comparison is not that straightforward, because forests provide other benefits over bogs. In any case, the global warming situation is so dire that this is not an either/or proposition. The purpose of this discussion is twofold. One is to draw attention to peat bogs as at least just as important as forests for preservation and expansion, including the use in carbon offset programs. The other is to delve into the science of why peat moss is more effective than other plant matter in capturing and storing carbon.
Sphagnum mosses are the dominant species in peat bogs. They are specially adapted to thrive in low pH (acidic), anaerobic and nutrient poor waterlogged environments. The bog microbiome (defined as a mix of microbes) plays a critical role in the fate of the Sphagnum. The microbiome is dominated by bacteria, but also has fungi. The microbes are highly specific to the Sphagnum, indicating plant-microbe co-evolution. This specificity is believed to increase the carbon fixation efficiency, and to adapt to changing climatic conditions. An Oak Ridge National Laboratory investigation showed that heat tolerant microbes transferred heat tolerance to the Sphagnum.
A key feature of the low pH and anaerobic environment is that when the mosses die, they sink into the bog and do not decompose, thus retaining the carbon for incorporation into the peat layer. Meanwhile new moss grows above. This unique ecosystem carries on fixing carbon from the atmosphere in a manner far more effective than any other natural means. Yet, possibly through a failure to recognize the value, or through a desire to repurpose the land for commercial interests, many of the peatlands have been drained. In the state of North Carolina, nearly 70% of peatlands were drained, according to a Nature Conservancy report (Afield, Spring 2023), a reading of which was the impetus for this discussion. Drained peatlands cease to be carbon absorbers and become emitters. In the more spectacular instances, fires lit by lightning strikes have burned and smoldered for up to a year, spewing as much as 270 tons of CO2 per day. This duration of a year is not surprising because the fire can go underground, where the fuel is plentiful.
Reforestation is a laudable goal. As is the support of the many ongoing investigations targeting passive and active capture of CO2 from the air. But, equally, restoring peatlands and protecting existing ones ought to be a priority. Nature has already provided an efficient CO2 sponge. We must feed it*. Adopt a bog.
Vikram Rao
* Sat on a fence, but it don’t work, from Under Pressure, by Queen and David Bowie (1981), written by Roger Taylor, Freddie Mercury, David Bowie, John Deacon and Brian May.
Reducing the Electric Vehicle Carbon Footprint
March 7, 2023 § 2 Comments
Electric vehicles are critical in the effort to mitigate climate change effects. But they do have a significant carbon footprint, driven by the fact that more energy is used to manufacture an EV than an equivalent gasoline driven car. Over a lifetime of use, however, the emissions from gasoline combustion dominate. A study at Argonne National Laboratory estimates that the lifetime greenhouse gas emissions from EVs are 40% of those from gasoline powered vehicles, as depicted in the figure. We discuss here how we could do better than that.

Source: Argonne National Labs GREET 2021, as cited in Electric Vehicle Myths | US EPA
The variability in the particulars of both types of vehicles necessarily makes such estimates inexact, and yet instructive. Both have assumed lifetimes of 173,151 miles and the EV has a range of 300 miles, while the gasoline engine delivers 30.7 miles to the gallon. This places the vehicles roughly in the vicinity of compact cars or small SUVs. With the decimal points and all, you know a model dictated the results!
In the bottom two buckets, the bulk of emissions are from energy used in the manufacture of materials and assemblies. For most metals, primary production (from ore and other sources such as brine) is more energy intensive than secondary production, also known as recycling. In steel, for example, a tonne of conventional steel has an associated CO2 production of 1.8 tonnes. An improved process, known as Direct Reduction Iron (DRI), with limited scalability, has a third of that, and with a variant that takes it to near zero. Scrap iron and steel, simply melted with some refining action, has a fraction of the DRI figure. But due to economic availability, only 30% of steel is from scrap.
EVs have on average 900 kg steel, which is about 6.9 grams/mile, or about 27% of the “other manufacturing” component in the figure. Green steel use would eliminate most of the steel contribution. The steel industry is actively addressing the issue. One startup is producing electrolytic iron, which is green if the electricity is carbon-free. Carbon capture at the iron production source would get most of the job done economically in areas such as Europe with an explicit price on carbon.
Minerals other than iron comprise 210 kg per vehicle on average. The largest contributors are graphite 66.3 Kg, nickel 39.9 Kg, and cobalt 13.3 Kg. Significant energy is expended in their production, even though graphite is largely a derivative of a petroleum refining waste. When batteries are recycled, nickel, cobalt and lithium will have lowered carbon footprints.
The gray portion is the largest contributor in EVs, and mostly comprises the carbon emissions associated with the production of electricity. In this figure, they used the national average for the US in 2020, when the renewable portion was 21%. The Energy Information Administration forecasts that figure to double by 2050. To the extent that EVs are charged in homes, averages apply. But public charging could well use a higher proportion of carbon-free power. A startup in India has a portable solar unit for charging stations.
The gray component is also affected by electricity used per mile. These figures are notoriously hard to compute because vehicles and driving conditions vary. One of the earliest cars to go all-electric was the Nissan Leaf. It came out with a 40-kWh battery pack which targeted range of 149 miles. This computes to about 0.27 kWh per mile. Later models with a 62-kWh pack had a range of 226 miles. This too computes to 0.27 kWh per mile, which is a trifle surprising because the heavier pack ought to deliver worse mileage. I calculated battery pack weights for several models and found 6.4 kg/kWh to be a reasonable figure. The newer Leaf model could have been expected to be 141 kg heavier than the earlier model which weighed in at 1490 kg. But the effect of greater weight is felt in pickup trucks. From public records I conclude that the Ford F150 Lightning and the Rivian R1T clock in at 0.49 and 0.42 kWh per mile, respectively. This is not surprising because these vehicles are more rugged and built to pull loads.
Electricity will get greener over time and recycling will surely become more common, if for no other reason than worries about supply of lithium, cobalt and nickel, and concerns about dodgy working conditions in the countries home to the major supplies.
I decided to use the Hyundai Ioniq 5, the Motor Trend SUV of the year, for a discussion of driving options. This model, as do many of the others in the same general category, offers two range options: 240 miles range with a 58-kWh battery, and 300 miles with 77 kWh. Based strictly on battery size, the weight difference is nearly 7%. I compute battery cost difference to be about USD 3800, based on an estimated battery retail cost of USD 200 per kWh. So, a consumer is paying more and emitting more CO2 (due to increased weight) by opting for the longer range. But what if Level 3 (high voltage DC) fast charging were available at multiple points, including every rest stop on the highways? I estimate that Level 3 chargers can fill at the rate of 3 kWh per minute. That means the difference in capacities of the two versions of the Ioniq 5 can be made up in 6 minutes. 6 minutes. That’s shorter than the time at the rest stop to hit the rest room, or “walk” the dog, or grab a snack. Curiously, the battery size difference for the Ford F 150 Lightning is also the same as for the Ioniq 5, although the CO2 penalty per mile is greater for that vehicle, as discussed in a recent NY Times piece. But the consumer can opt to buy the lower range model and make up the difference in range with only minimal inconvenience.
Existing plans to decarbonize the grid will drive down the carbon footprint of EVs, as will any policy drivers to encourage recycling of EV batteries. But interestingly, investment in Level 3 charging infrastructure could influence consumer behavior which results in reduction in use of critical minerals such as cobalt and nickel, with a further knock-on effect of reduction in carbon footprint. Critical minerals access could be important when EV adoption hits high gear and puts strains on the supply chains. And every carbon mitigation approach is another brick in the wall*.
Vikram Rao
*just another brick in the wall, from Another Brick in the Wall, by Pink Floyd (1979), written by Roger Waters. Not the common interpretation of the lyric.
Vulnerabilities to Energy as Weapons of Political Will
February 7, 2023 § Leave a comment
Low-cost energy lifts all boats of economic prosperity. Equally, the opposite is also true. Over the years, countries have used energy as weapons of political will. When that has happened, the cost of that unit of energy has risen, thus achieving the intended privation to influence a political position. But not all forms of energy are equally susceptible to this manipulation. Examining just the scalable low-carbon energies of the future for vulnerability to supply chain disruption, the likely rank order in increasing vulnerability is advanced geothermal systems, small modular reactors, innovative storage means (including hydrogen), wind electricity and solar electricity.
Given the magnitude of the impact of the curtailment of energy access, small wonder that energy exporting nations use energy access as weapons of political will. In the last half century there have been two of note. One was the oil embargo portion of the trade sanctions against South Africa in an effort to influence abandonment of the apartheid policy. It was only moderately successful in of itself because of backdoor supplies. But it did cause the first successful commercialization of gas to liquids technology. Eventually, other factors forced the policy changes eliminating apartheid.
A more dramatic one was the Arab Oil Embargo in 1973, in retaliation for a pro-Israeli stance by the US and others in the Yom Kippur War between Israel and Egypt. It lasted only about 6 months in the US (bit more elsewhere) but caused economic havoc and permanently raised the price of oil. This emboldened oil exploration in the North Sea and justified the Canadian oil sands. The latter, in no small measure, contributed to North America now being essentially self-sufficient in oil and gas. The North Sea oil and gas boom made Europe less reliant on the Middle East. In that sense, the embargo acted against the interests of the authors. But the use of oil as a weapon of political will, no matter the outcome, was established.
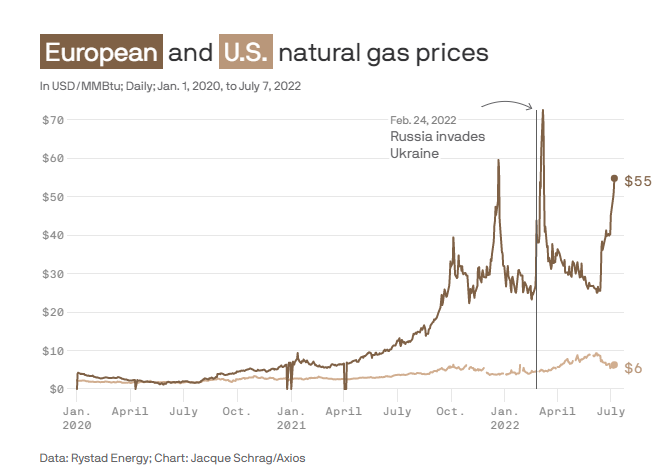
A smaller saber rattle was in the winter of 2009, when Russia cut off natural gas supplies to Europe to punish Ukraine, through where the pipeline traversed. It was only for 10 days but taught a lesson which certainly was not learnt by the Germans and other Europeans. Shortly thereafter, increased reliance was placed on natural gas from Russia. And now look at the consequences. The Russian invasion of Ukraine, accompanied by the reaction by much of the world to reduce or eliminate imports of energy from Russia, has caused a spike in the cost energy. The wild swings in the cost of natural gas in Europe, as compared to relative stability in the US, are shown in the figure. This has rippled through the economies of the world.
Remedies for Energy Used as a Weapon
One remedy would be to have energy treaties with trusted neighbors, much the same as defense treaties. This would apply to virtually any source of energy, but best suited for oil, gas and electricity. Interdependency helps. Mexico is short of natural gas and has surplus heavy oil, which is well suited for US refineries, and plentiful US shale gas is dispatched in exchange. Canadian heavy oil is mostly sent to the US, where refineries prefer it to the domestic shale oil, in part because it sells for a discount of about USD 20 per barrel today. South Asia does not as yet have anything codified but could, possibly with India as the hub. The trust aspect would probably limit any India focused South Asia grouping to just include Bangladesh, Bhutan, Sikkim, Sri Lanka, Maldives, and possibly Myanmar.
In a de-carbonizing world, the energy of the future is largely carbon-free electricity. A disruption, were it to be attempted, would come in the form of limiting access to key elements of the supply chain, not the commodity itself. Carbon-free electricity is a mixed bag in being susceptible to supply chain disruption. Considering just the US as an example, wind energy is probably fine, with the componentry largely sourced domestically. But as in most manufactured items today, supply is distributed. The largest sources are three European countries combined, and India.
Solar power, on the other hand, sources the vast majority of componentry from China, even though the assembly may be in neighboring countries such as Malaysia, making the import seem to be from those countries. Over 80% of polysilicon used worldwide for manufacture of solar panels is from China. Risk to supply can originate from action at either end. The Chinese factories producing polysilicon are believed to discriminate against a minority. But if the reaction to Russian aggressions is any indication, the US may not initiate anything. In the case of Russia, enriched uranium (uranium with higher concentration of the fissionable U235 in the U238 than found in the mined ore) was discreetly not in the list of import bans from Russia, probably because it was too necessary. Russia is the largest supplier to the US, at about 30%.
It is still too early to tell where components will get sourced for small modular reactors (SMRs), because none or being made in manufactured quantities yet. But the likelihood for sourcing from friendly countries is high except for the enriched uranium. But the enrichment process is well understood and could be ramped up in most trusted countries. Processing of spent fuel, as already practiced in France, will conserve resources. Furthermore, the breeder reactor versions using thorium in place of uranium would benefit from the fact that a major source would be Australia. India too has significant reserves of thorium.
The winner in the insulation from sanctions sweepstakes is the class of offerings known as advanced geothermal systems. They use conventional equipment from the oil and gas industry, and in fact will pick up personnel and equipment increasingly made redundant with upcoming demand destruction in oil. They, together with SMRs, are ideal for filling the temporal gaps in solar- and wind-based electricity production.
Energy treaties with friendlies*, and choice of energy sources most impervious to external manipulation are the best recourse against the use of energy as a weapon of political will.
Vikram Rao
February 7, 2023
*With a little help from my friends, from With a Little Help from My Friends, the Beatles (1967), written by John Lennon and Paul McCartney
SPR Now Stands for Selective Political Rhetoric
February 2, 2023 § 5 Comments
Two weeks ago, The House entertained 140 amendments to HR21, a bill intended to influence the drawdown of the Strategic Petroleum Reserve (SPR). President Biden had executed a drawdown last year in response to oil supply disruptions caused by the Russian invasion of the Ukraine. An amendment by Marjorie Taylor Greene seeking to halt the drawdown was defeated 418 to 14, a historic beat down of any amendment. That is interesting, and embarrassing for her, but what in Sam Hill is going on here?* The answer, further detailed below, is that the SPR has been passe for quite a while. Now, it is just a piggy bank for the administration in power and a convenient political football for the opposition, the latter being emboldened by the fact that the public (including “experts”) does not realize that the original purpose of the SPR is no longer relevant, certainly not at its current size. Here’s why.
The Arab Oil Embargo in 1973 caused a major supply disruption in the US. President Ford signed the Energy Policy and Conservation Act in 1975, which enabled a petroleum reserve of up to 1 billion barrels of oil in four locations in Texas and Louisiana. This target was later lowered to 714 million barrels. The purpose was to ameliorate the effects of “economically-threatening disruption in oil supplies”. SPR releases have been ordered 3 times prior to the current one, twice by Republican Presidents and once by a Democrat. There has been no hint of releases being a partisan issue. Until now.
The three previous releases were in 1991 (Desert Storm driven), 2008 (Hurricane Katrina), and 2011 (International Energy Agency led effort in response to dramatic supply disruptions in Libya and elsewhere). The significance of the year 2011 is that US shale oil production hit its stride shortly thereafter. Once it did so, two aspects became clear. One, that the reserves were enormous, and two that production could commence within months of financing and permitting. Several thousand drilled, but not completed (DUC, pronounced duck) wells could come on stream even faster, and nearly half the cost would already have been incurred. Today, North America is essentially self-sufficient in oil, and natural gas too, for that matter. This is a far cry from the Arab Oil Embargo days that caused the creation of the SPR. Back then, the US was heavily dependent on imported oil and new domestic oil production, especially offshore, would take years. Today, shale oil in the ground is the strategic reserve.

Let’s discuss timing. SPR releases are limited to a rate of 1 MM bpd (one million barrels per day). 90 MM barrels could be drawn in 90 days, or roughly 3 months. Double that and we have 180 MM barrels in 6 months. Currently, the SPR is at about 370 MM barrels. That could get drawn down another 100 MM barrels and still leave enough cushion for shale oil production to pick up the slack in the event of a catastrophic curtailment of normal oil supply. Not only is the current drawdown to 370 MM barrels not consequential to national security, even a further withdrawal would be safe. There is a caveat. Many small operators went bankrupt during the Covid related demand drop and the properties are now with more fiscally conservative owners. Therefore, in the event of a true national energy related emergency, the government may need to step in to assure the necessary production. Persuasion largely failed in the last year or so, but nor did we have a dire situation. In fact, none of the three previous releases were triggered by anything approaching the threshold of supply disruption envisioned when the SPR was authorized. In each case, as in the one ongoing, the release was coordinated with other countries. The US portion was about 30 MM barrels on each occasion, a barely noticeable dent in the total (see figure). So, in close to half a century after creation, the SPR has never been needed for the original purpose. US shale reserves and the feasibility of relatively rapid production ramp up further reduce the justification for anything more than a modest reserve of 200 MM barrels. The current brouhaha over withdrawals is a tempest in the SPR teapot.
Vikram Rao
February 2, 2023
*Everybody look what’s going down, from For What It’s Worth (Stop, Hey What’s That Sound), song by Buffalo Springfield (1966), written by Stephen Stills.
A Stranger in No Land
October 31, 2022 § 1 Comment
I published my “fun book” nearly six months ago, entitled A Stranger in No Land, tales of assimilation. With considerable reluctance, because it smacks of self-promotion, I am linking you to it. The sneak peek that Amazon gives is well selected. But the Preface may be more informative relative to your wanting to investigate it any further. Accordingly, it is reproduced below. The cover art is a painting by my mother, and the illustrations are by my grandniece. As I noted, a fun book.

PREFACE
“People are strange when you are a stranger”
From People are Strange by The Doors (Written by Robbie Krieger and Jim Morrison)
As the Doors song line goes, a stranger in a new land will be faced by strange behavior. The episode described in If it Moves. . . was the author’s introduction to the stark contrast in sexuality of California in the 1960’s to the experience of a 21-year-old from the all-boys (at the time) Indian Institute of Technology in sleepy Madras. Culture shock about defines it. These shocks can range from the essentially pleasant and intriguing, as was this one, to the shocking. But they all share the trait of a feeling of inadequacy. Of a lack of preparedness.
In this situation, the stranger has two choices. One is capitulation. (S)he simply returns home. This may not be a physical return; it could merely entail making a choice not to be involved in said activity. In context, home is a zone of comfort. Similarly, the interpretation of “land” in the book title would be a place or pursuit (public speaking, for example), not necessarily a country. When I (the author) was a child, the capitulation option was not available when the family moved every couple of years on postings. Children of such professional nomads, affectionately known the world over as army brats, are reduced to the second choice. Assimilate. Minor avoidances are possible, such as school changes. But in the main, one simply fits in. Personality differences matter for the ability to fit. I was blessed with malleability and the childhood experiences served to inspire confidence that I would not be a stranger in any land for too long.
This book is largely devoted to tales of assimilation. Characters appear with the familiar names used by the author in addressing them. The meanings of the names and relationships to the author may be found in the Glossary.
The principal criterion for inclusion as a chapter was that something interesting or fun had to have happened. On more than one occasion, that criterion was compelling in its own right. Assimilation took a back seat unless one indulged in flights of fancy to find that association. The Scrooge Strategy was one such. At a performance of The Christmas Carol, the actor playing Scrooge took some extemporaneous license which appeared to give Scrooge a sense of humor. This emboldened me to present a side of Scrooge that Mr. Dickens never intended. Business schools tempted to include the Scrooge Strategy in their branding classes best come calling for permission.
In Jodhpur I do start the book at the beginning of the journey. An early chapter is Forty-nine Not Out which recounts the considerable step for a 16-year-old to leave home on a two-day train journey to live and study at an elite institution where everybody could be expected to be as competent as he. This would be unlike the relative walk in the park high school experience. That I became comfortable enough even in the first year to take time to help launch the campus monthly Campastimes is as much a testimony to the embrace of the setting as it is to my assimilative skills. That is when my love of writing emerged. My second to last book is dedicated to Campastimes, and not to a person.
The Stanford University years are prominently represented, beginning with If it Moves, and followed by Forks in the Academic Road and De-mystifying Legendre. These last two have more academic underpinnings, but fitting in takes many forms, and the “something interesting happened” stricture was always in play. That period was transformational. The process of becoming an American was well under way at the end of the Stanford era, even recognizing that California, especially in the sixties, might not have been fully representative of the US. Domicile had not been intended. The plan had been a master’s degree at Stanford, at essentially no cost, followed by a return to India. Events conspired.
The next major change, working for a living, at first on the other coast and later in Houston, merited three chapters as well. All fall in the main theme of the book, beginning with Folded or Crumpled, with an amusing rite of passage at work. When Cultures Cross and When in Rome have the shoe on the other foot. I am now the American dealing with strangeness in England and France, respectively. Interestingly, once one crosses a major cultural barrier, all the rest appear easier to traverse. In When Cultures Cross, I am put in the position of saying grace prior to the company Christmas meal in Cheltenham, England. With ten minutes notice. The Director of the facility realized he was no longer the senior person present; I was. Custom decreed that I, the Hindu, who had only read about such things, perform. Perform, I duly did; having read Jane Austen came in handy.
The two chapters The Rao Dog Tells Tales and The Last Lap for the Rao Dog relate to the assimilative trials faced by our dog Kalu following adoption from the SPCA. Written in her first person, it will be annoying to some. My defense is Peter Mayle. Not that I aspire to his stature, but this author of A Good Year1 also took a flyer with a first-person narration by his dog in A Dog’s Life2. A great read, as are many of his other books set in and around Provence.
Even the chapters departing from the assimilation theme have elements of cultural differences. Culinary Matters describes the compelling social circumstances under which horse was consumed for the first (and last) time in West Germany (was West and East back then). Close Encounters, on the other hand, is a pure capitulation to whimsy. But closely adheres to the stricture of being interesting, with intent to amuse. If the last is all that a reader gets out of the book, I will be content.
1 Mayle, P A Good Year (2006) Vintage ISBN 0307277755
2 Mayle, P, A Dog’s Life (1996) Penguin Books Ltd. ISBN 0140261559
How Relevant is the Strategic Petroleum Reserve today?
October 1, 2022 § Leave a comment
There is a lot of teeth gnashing about President Biden ordering a limited drawdown of the Strategic Petroleum Reserve (SPR) earlier this year. A New York Times piece warns that the SPR is at its lowest level in four decades (see chart). How relevant is that statistic?
Let’s go back to how it all began. In 1973 the US was importing 6.2 million barrels per day (MMbpd). Today, it is the largest oil producer and a net exporter by a small margin. But importantly, about half the imports are from Canada, with whom the US has a mutual dependency. Canada has heavy crude the bulk of which is refined in the US, with a resulting export of refined products. Viewed in North American terms, imports from other parts of the world are minor.
Back to 1973. The Arab Oil Embargo to countries such as the US and the UK caused a tripling of the price of oil. To avoid such disruption, the US decided in 1975 to create the SPR. Since then, the crises that drove the decision have not materialized. Drawdowns have been few and light (see chart). In other words, even before shale oil and the resulting North American self-sufficiency, strategic access has not been needed. And yet, pundits, such as those in the NY Times piece, keep maintaining that someday the reserve may be needed*. We discuss that premise here.

The SPR comprises four salt caverns, created by drilling into salt bodies and excavating using circulating water. These are ideal for storage of oil. In fact, salt has been an important impermeable stratum to trap oil in reservoirs. At its peak the reserve had about 719 MM barrels. It was filled over the years and has a low average purchase cost of USD 28 per barrel. While the President’s purpose was to ease the cost of gasoline at the pump for the populace, the sale of SPR oil is coincidentally generating a profit for the government at today’s prices.
Oil is not all the same. One reason the US imports oil from Canada and Mexico, while at the same time exporting domestic production is that US refineries prefer the heavy oil from those countries. They have expensive process equipment to refine such oil, which they get at a large discount because the cost to refine is higher for these crudes. To pay more for light shale oil, while at the same time idling the expensive kit, makes no economic sense. And unlike the European situation with Russian oil and gas, the imports are from friendly neighbors who need the US refineries.
Similarly, the oil in the SPR is not all the same. Over 60% of it is high in sulfur (designated sour) and has significantly lower value than the sweet oil. The final withdrawals this year are 85% sweet, possibly because that is the mix most suited for purchasers. If, and when, shale oil is injected, it will improve the quality of the balance. But that ought not to be necessary. Here is why shale oil could directly address any shortfalls in supply.
First, there is a significant inventory of DUC wells. DUC stands for drilled and uncompleted and is pronounced duck. I will spare you duck hunting allusions. The hydraulic fracturing portion of the completion is the costly part of the operation. It was suspended for some wells during the low oil prices of a few years ago and the wells were mothballed. Such wells can come on stream in a matter of weeks. Second, even new reservoirs can be accessed and flow oil in a few months. Environmentalists are concerned that new wells will perpetuate fossil fuel production. Ordinarily they would be right for, say, deep water wells. But shale oil wells are burdened with high rates of reservoir depletion. Production from the first couple of years must justify the return on investment. The capital asset does not need years of production to provide the return, as it would for conventional plants such as refineries, or deep water wells, for that matter.
The drawdown executed by the US administration of about 1 MMbpd for 180 days is nearing the end, with 160 MM barrels already released. The reserve is at about 420 MM barrels and will drop to 400 MM barrels by the end of the year. In the unlikely event that the strategic purpose of the SPR is invoked, and it has not since its inception, that amount provides a cushion while additional shale oil is brought on stream. Over the last few years, the shale oil industry has been more restrained than in the past, seeking better returns. If this were to be a national security issue, short term policy measures could overcome that hurdle.
Shale oil in the ground is our strategic petroleum reserve.
Vikram Rao
October 1, 2022
*’Cause someday never comes, from Someday Never Comes, Creedence Clearwater Revival (1972), written by John Fogerty.
